Plusnet complaints skyrocket in Q4 2018
Complaints against the budget broadband provider doubled from 21 to 43 per 100,000 customers between Q3 and Q4 2018.
Following a poor entrance into the complaint league tables in Q3, Vodafone have improved slightly, although they still remain well above the industry average.
Figures were also released for landline, mobile and pay TV complaints, revealing Plusnet, BT Mobile and BT TV were the poorest in their respective sectors.

New system plagues Plusnet
Plusnet haven't been amongst the best in recent complaint tables, but their low of 43 complaints per 100,000 customers in Q4 2018 was the worst level by any provider for quite some time.
The switchover to a new billing system came in September 2018 and triggered complaints from both existing and former customers who received incorrect payment requests and billing notices.
In an unfortunate twist, the system remained offline while Plusnet attempted to solve the problems, meaning that customer service staff couldn't initially respond to complaints.
Issues continued to be reported by Plusnet customers throughout Q4 and into 2019, suggesting that the figures for Q1 2019 may not signal much improvement when they're released.
Ofcom have recognised the reason for the spike in Plusnet's broadband complaints within their report, but it still represents a low point for customer satisfaction and may well have lost them some customers.
Plusnet refreshed their brand in 2017 and phased out traffic management, although this was offset by a rise in prices.
Read our full review of Plusnet Broadband here and learn more about their geographical pricing model in this article from 2009.
How did other providers fare?
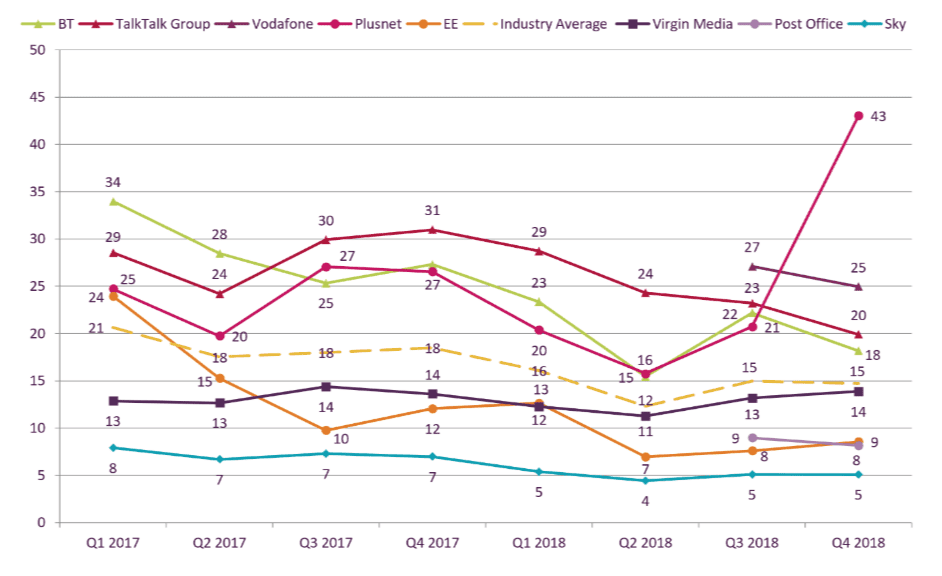
Ofcom fixed line broadband complaints 2018 Q4
There were no other major spikes or dips in customer complaints for broadband providers in Q4, although EE and Virgin Media edged up slightly towards the industry average of 15 with 9 and 14 respectively.
Vodafone entered the table with a poor 27 complaints per 100,000 customers in Q3 2018 and have lowered this to 25 in the latest figures.
Meanwhile, the Post Office have switched places with EE to become the second-lowest provider in the table with just 8 complaints per 100,000 customers, only beaten by Sky.
Sky's record in broadband complaints is consistently excellent, and it's mirrored with their performance across the other sectors of landline, mobile and pay TV.
Complaints across other areas
Ofcom's official complaint figures show Plusnet's system woes contributed to a leap in their landline complaints too, up to 33 from 17 in Q3 2018.
Except for Plusnet's spike, the general trend for landline complaints is downward, with Vodafone managing to lower their figures from 19 to 14.
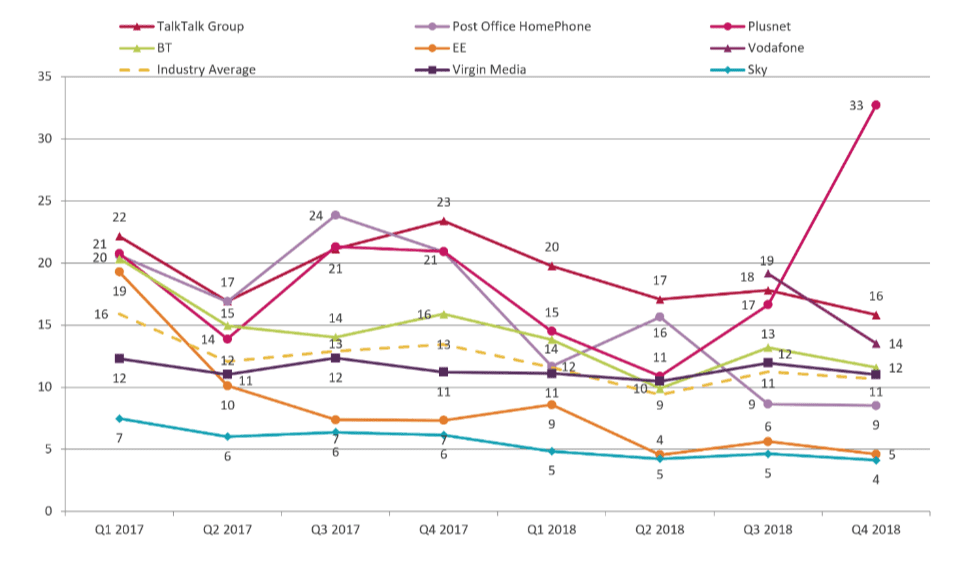
Ofcom landline telephone complaints 2018 Q4
Pay monthly mobile complaints remain at historically low levels. BT Mobile, Vodafone and Virgin Mobile are tied for the most complained about providers with 7 complaints per 100,000 customers, while EE, Tesco Mobile and Sky the least complained about.
Following a spike in pay TV complaints for both Virgin Media and BT in Q3 2018, these levels have settled from 19 and 15 respectively to 10 and 12.
This puts BT at the top of the table once again after they managed to hit a low of 7 in Q2 2018. Main drivers of complaints were billing, pricing and charges.
Ofcom have been publishing these complaint trend reports since 2011, and these demonstrate dramatic falls in the average number of complaints related to fixed broadband and landlines.
Pay monthly mobile complaints have decreased from 13 at the time of first publication to just 4 in the latest figures, while pay TV complaints have remained steady at around 5 per 100,000 customers since 2011.

We're independent of the products and services we compare.

We order our comparison tables by price or features - never by referral revenue.

We donate at least 5% of net profits to charity, and operate a climate-positive workforce.
Related guides


View more guides